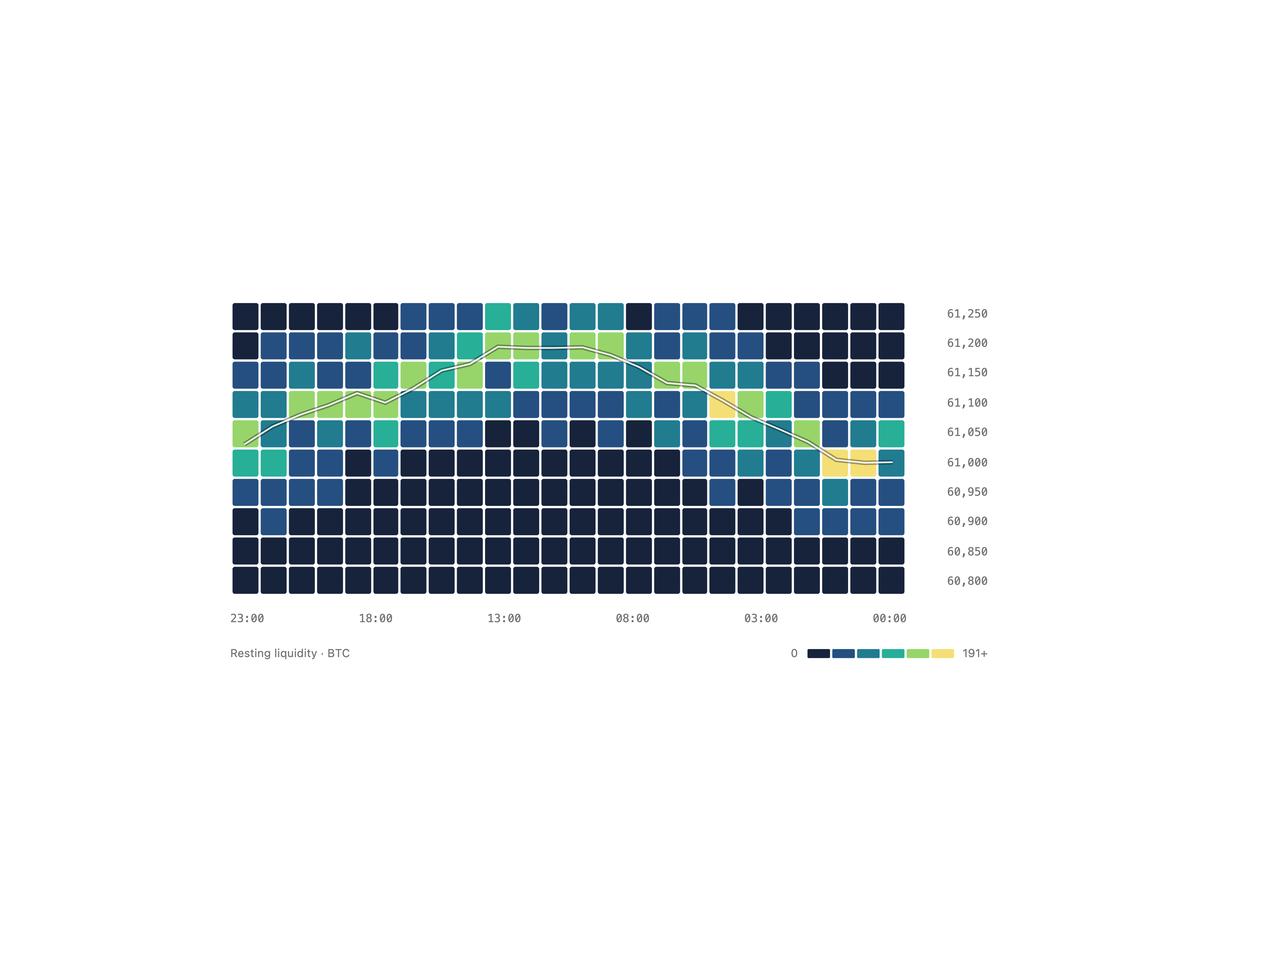
"use client";

import LiquidityHeatmap from "@/components/ui/liquidity-heatmap";

function buildSnapshots() {
  const priceLevels = [
    61250, 61200, 61150, 61100, 61050, 61000, 60950, 60900, 60850, 60800,
  ];
  const columns = 24;
  const snapshots = [];
  let center = 61025;
  let seed = 42;
  const rand = () => {
    seed = (seed * 1103515245 + 12345) % 2147483648;
    return seed / 2147483648;
  };
  for (let i = 0; i < columns; i++) {
    center += Math.round((rand() - 0.5) * 60);
    const levels = priceLevels.map((price) => ({
      price,
      size: Math.max(
        0,
        Math.round(
          140 * Math.exp(-Math.abs(price - center) / 90) * (0.5 + rand()),
        ),
      ),
    }));
    const hour = (23 - i + 24) % 24;
    snapshots.push({
      id: `t-${i}`,
      label: `${hour.toString().padStart(2, "0")}:00`,
      levels,
      price: center,
    });
  }
  return snapshots;
}

const snapshots = buildSnapshots();

export default function LiquidityHeatmapDemo() {
  return (
    <div className="w-full max-w-2xl">
      <LiquidityHeatmap
        snapshots={snapshots}
        unit="BTC"
        label="BTC/USD liquidity heatmap"
      />
    </div>
  );
}